
The UK Giving report from CAF was released last month and in the sector press again.
I thought I'd give a quick rant about it, as the fact remains that surveys are not a good way to estimate total giving, and the headlines are pretty close to meaningless. My colleague Cian and I wrote a blog on this a number of years ago, and most of the points still stand. It’s worth remembering then that CAF and NCVO predicted that individual giving had fallen by 20% in 2012. There was never any evidence that it had.
As a point of illustrating that using survey data to estimate giving is a bad idea, I had a look at our own data (as we ask people how they had given for a cross-tab in our awareness surveys). The average quarterly gift in January 2016 was £52.55. The proportion of givers was 0.72. This means the point estimate for average quarterly gift for adults in the UK is £39.28, or an annual gift of £157.10 (multiplying by four). Multiplying this by the adult population of 52,443,290, according to the ONS, gives an estimate of £8.23 bn. This is about as far as commentary tends to go on the UK giving report - whether this headline figure goes up or down.
What makes use of this headline all but meaningless is not reporting confidence intervals. So as the statistical literate dogs on the street know, the formula for variance of a product (i.e. when we multiply two figures together like we have with the average gift and the proportion of people giving) is:
Var(XY)=Var(X)Var(Y)+Var(X)(E(Y))2+Var(Y)(E(X))2
Plugging in the appropriate figures and sample size gives a standard error for the average quarterly gift of £2.92. The usual confidence interval then means that the interval for the average quarterly gift is £39.28 +/- £5.73. Scaling this up to annually makes it £157.10 +/- £22.91. Scaling this up to the UK population means a 95% confidence interval of £7.04bn to £9.44bn! In other words, a "drop" in the order of £600m is completely insignificant statistically. CAF does have a larger sample, which (assuming similar variance) would shorten the confidence interval a bit, but it would still be £7.64bn to £8.84bn charitably for a confidence interval.
Aside from any arguments about confidence intervals, our data also shows just how volatile the amounts of self-reported giving are. The chart below shows the quarterly amounts that people claim to have given. Even the statistically illiterate will notice that the amounts go up and down substantially. 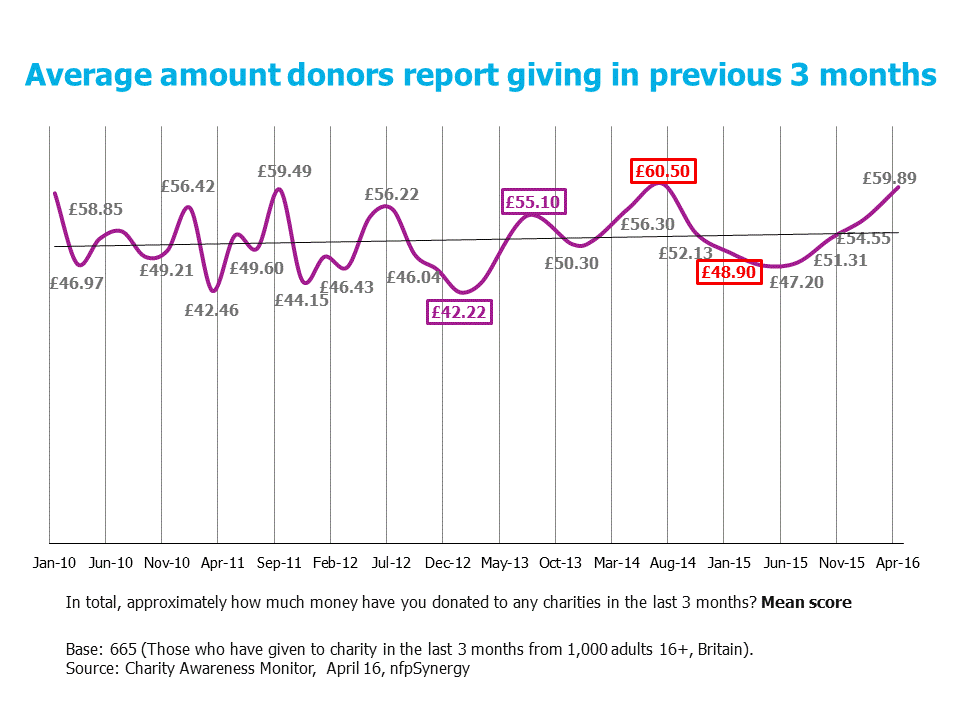 So if a measurement was taken between January 2013 and July 2013 the report giving levels went from £42.22 to £55.10, an increase of 30% (or ‘Giving surges by 30%’ in headline terms). Conversely, if a measurement was taken between July 2014 and January 2015 the headline level of giving fell, from £60.50 a quarter to £48.90 (or better known as ‘Giving plunges by 20%’). This is a drop of 20%, but by April 2016 it had all but recovered. According to these figure from summer 2015, as fundraising took its fiercest media battering in a generation, giving increased remorselessly according to this data.
The real issue here is that surveys are not a good way to measure giving levels, not done by CAF or nfpSynergy or anyone else. The problems with people self-assessing their own giving are too great: both because human memory is not good enough, and the likely bias from the desire to ‘look good’ when it comes to giving are very strong.
As the impact of new fundraising regulation kicks in, changing public attitudes to giving, tighter data protection from the EU and continued economic uncertainty, it’s more important than ever than we have a good idea of whether giving is going up or down, in weeks or months, not years. At the moment, our inadequate choice is between the short-term volatile and inaccurate survey-based methods, or the slow, inflexible, annual accounts based method which can take up to two years to report. The sector and its beneficiaries deserve better.
Joe,
Joe,
Thought provoking as always. Good to have a point of view and challenge existing thinking.
I think we should measure the following:
1. CASH: donations and legacies
2. MEMBERSHIP: Annual ( building in 'life' whilst important is difficult to measure)
3. TIME: over time there should be a value attributed to volunteering peoples time. This is an area of future growth; we are all aware of the ageing population, but this and falling pensions will likely impact negatively on cash giving.
Perhaps in the medium time we should consider a 'composite' measure that takes into account the 3 ways in which people engage with organisations.
Peter Curtis
07815 798485
Joe, thanks for re-visiting
Joe, thanks for re-visiting this important issue. Two comments:
1. The "total voluntary giving" is an important indicator, but what really matters for the health and sustainability of the charity sector is the net contribution from voluntary giving, after all the relevant expenses. At the moment this doesn't appear to be published at a national level, though theoretically it could be estimated by analysing the detailed notes at the back of charity accounts.
2. You mention only two sources of data, imprecise surveys and long-after-the-event analysis of annual reports. Think a third source could be developed, probably by independent academics. This would entail using confidential data on monthly totals of transactions from large-scale commercial processors of consumer charity transactions like HMRC (Gift Aid claims), Just Giving, RapidData, Virgin Money and CAF. If each processor supplied monthly totals of moneys processed and donor numbers these could be amalgamated to give a clear indication of overall trends. Several of these processors already provide annual data, so it should be possible for an independent body to collate them in a meaningful way for more regular publication.