
How do we know if charities are doing a good job and how do we judge their success? These are age-old questions the answers to which have come to define the work that charities do.
Back in 2013 US Commentator Dan Pallotta said, provocatively:
"[The charity sector] doesn't seem to be working. Why have our breast cancer charities not come close to finding a cure for breast cancer, or our homeless charities not come close to ending homelessness in any major city? Why has poverty remained stuck at 12% of the U.S. population for 40 years? And the answer is, these social problems are massive in scale, our organizations are tiny up against them, and we have a belief system that keeps them tiny."[1]
Dan Pallotta, Entrepreneur
A somewhat provocative statement but it does prompt some interesting questions of which nfpSynergy posed back in 2016 in a free report titled ‘Past Imperfect: How successful have charities been over the last few decades’. In it, we assessed 5 different sectors: cancer, heart disease, disability, poverty and the environment drawing on a range of readily available data to illustrate how these issues were being tackled. This blog takes a scan of two of those sectors addressed in that report (health and poverty), using key statistics that have shed some light in demonstrating the progress (or lack of) evidenced within these two areas of concern.
Zoning in on the issue of health and disease, our report placed a specific focus on the declining mortality rates seen in diseases such as cancer and heart disease. Data from Cancer Research UK showed that between 1992-2012 the numbers of people dying from cancer in the UK decreased by 27% in males and 20% in females. These declining mortality figures can be attributed to a variety of factors most notably an improvement in treatment and more effective diagnosis thanks to further progressions in science and technology.
Chart 1: All Cancers, European Age-Standardised Mortality Rates, UK, 1971-2012
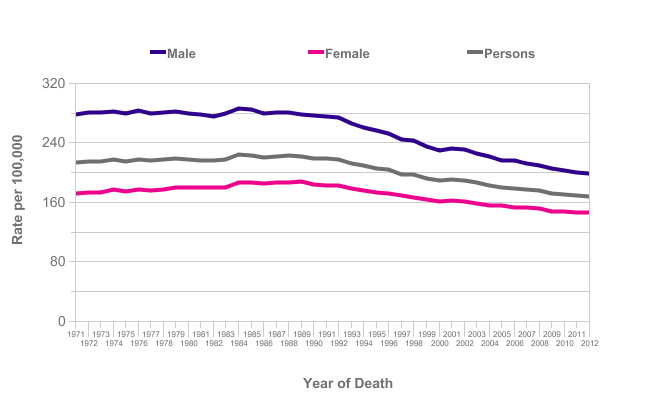
 [2] Source: Cancer Research UK, Cancer Mortality Statistics, 1971-2012
Such trends are obviously great news for any charity working in the cancer sector but with an increasing number of people living with diabetes and obesity in the UK, how these trends will be affected in the coming years will be of great interest to how those charities approach their messaging and campaigning moving ahead. Indeed, the above figures show a gradual slowing down in the decline of mortality rates towards stagnation. Cancer Research UK is already at the forefront of raising these concerns highlighting that more than 6 in 10 adults in the UK are now classed as overweight or obese and that after smoking, obesity is now the biggest cause of cancer. Campaigning on these issues hasn‘t been without difficulty however following a recent CRUK campaign which was criticised for what some people saw as stigmatising and discriminatory in its nature.[3]
While this shows that it’s not going to be easy communicating these matters to the general public, what CRUK has shown is an awareness that downward trends are not a given and that charities must be prepared for scenarios or issues that could interrupt such trajectories. Therefore, all charities should be aware that no problem being tackled is static and the example of the impact of obesity on cancer mortality is a case in point.
Our report from 2016 also focused in on poverty rates in the UK and worldwide. Looking specifically at the UK, data from the Joseph Rowntree Foundation (supplied by the IFS) showed declining levels of poverty amongst pensioners and, less dramatically, children. However, since our report was released, the projected level of child poverty in the UK is set to increase with the Institute for Fiscal Studies predicting that relative child poverty will rise substantially to 36.6% in 2021 from 29.7% in 2015. [4] As ever, the finger of blame will be pointed at the government for these grim forecasts. Retrenchment as well as the loss of legal support in many social welfare cases has undoubtedly worsened things over the last few years and has increased the urgency and pressure on social charities working to alleviate such issues.
Chart 2: Proportion in poverty by age group, 1982 to 2012/13
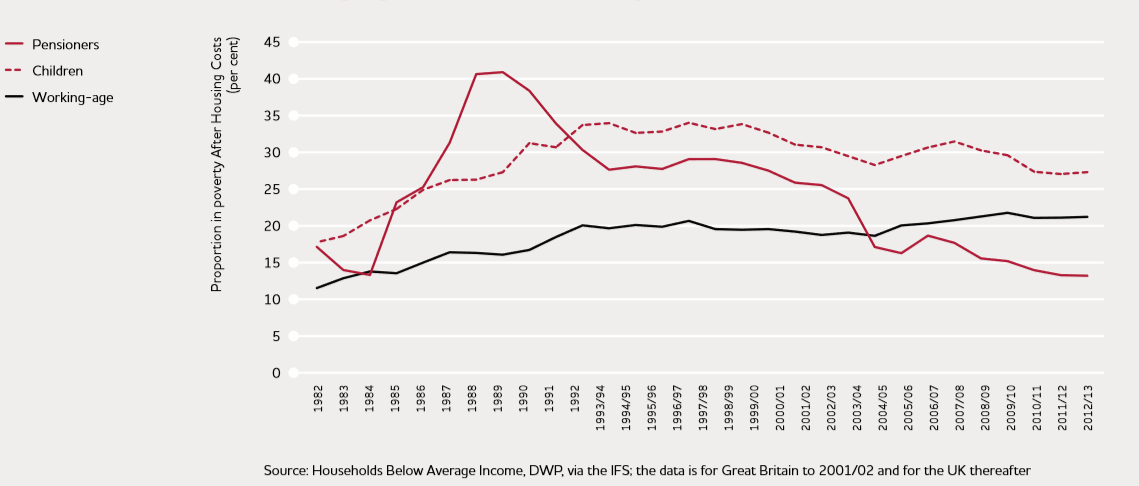

[5] Source: Monitoring poverty and social exclusion 2014, Joseph Rowntree Foundation
But how do charities use and approach these statistics and forecasts and how much credit/blame should charities take? The answer, of course, is not simple. Attribution is a problem – who takes credit and who takes the blame for positive and negative trends is indicative of the highly complex nature of these societal issues. The role of government will always be a key determinant (as shown by UK poverty figures) and it is farfetched to expect charities to deliver radical change on their own but they do have a significant role to play. After all, one of the roles charities play is to bring about change to government behaviour that means that they play as integral a role in bringing about positive change. This may be self-evident but because of this role, there is little worth in trying to mollify those in society who complain that charities spend too much of their time campaigning. As our report in 2016 so rightly noted ‘those who say that charities should stick to their knitting and stop campaigning; campaigning is part of the knitting’. And let’s also remember, campaigning is just one strand of the multiple strategies that charities can use to change society. Whether it is through delivering services directly, changing public attitudes, or influencing government policy and corporate behaviour, the scope for bringing about change is massive.
If you want to read more about this, read our full report from 2016 here.
[1] Pallotta (2013) ‘The way we think about charity is dead wrong’, TED talks transcript, March 2013 http://www.ted.com/talks/dan_pallotta_the_way_we_think_about_charity_is_dead_wrong/transcript?language=en